Difference between revisions of "Kaplan Meier estimator"
| Line 2: | Line 2: | ||
<p>A plot of the Kaplan–Meier estimate of the survival function is a series of horizontal steps of declining magnitude which, when a large enough sample is taken, approaches the true survival function for that population. The value of the survival function between successive distinct sampled observations ("clicks") is assumed to be constant.</p> | <p>A plot of the Kaplan–Meier estimate of the survival function is a series of horizontal steps of declining magnitude which, when a large enough sample is taken, approaches the true survival function for that population. The value of the survival function between successive distinct sampled observations ("clicks") is assumed to be constant.</p> | ||
<div class="thumb tright"> | <div class="thumb tright"> | ||
| − | <div style="width: 386px" class="thumbinner"><a class="image" href="/wiki/File:Km_plot.jpg"><img class="thumbimage" alt="" src="http://upload.wikimedia.org/wikipedia/commons/7/73/Km_plot.jpg | + | <div style="width: 386px" class="thumbinner"><a class="image" href="/wiki/File:Km_plot.jpg"><img class="thumbimage" alt="" width="384" height="331" src="http://upload.wikimedia.org/wikipedia/commons/7/73/Km_plot.jpg" /></a> |
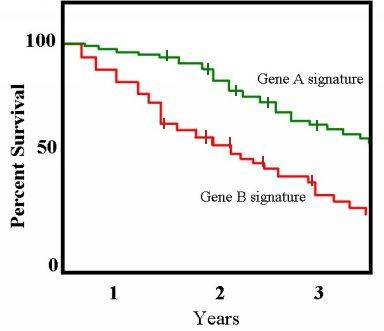
<div class="thumbcaption">An example of a Kaplan–Meier plot for two conditions associated with patient survival</div> | <div class="thumbcaption">An example of a Kaplan–Meier plot for two conditions associated with patient survival</div> | ||
</div> | </div> | ||
| Line 8: | Line 8: | ||
<p>An important advantage of the Kaplan–Meier curve is that the method can take into account some types of <a title="Censoring (statistics)" href="/wiki/Censoring_(statistics)"><font color="#0645ad">censored data</font></a>, particularly <i>right-censoring</i>, which occurs if a patient withdraws from a study, i.e. is lost from the sample before the final outcome is observed. On the plot, small vertical tick-marks indicate losses, where a patient's survival time has been right-censored. When no truncation or censoring occurs, the Kaplan–Meier curve is equivalent to the <a title="Empirical distribution" href="/wiki/Empirical_distribution"><font color="#0645ad">empirical distribution</font></a>.</p> | <p>An important advantage of the Kaplan–Meier curve is that the method can take into account some types of <a title="Censoring (statistics)" href="/wiki/Censoring_(statistics)"><font color="#0645ad">censored data</font></a>, particularly <i>right-censoring</i>, which occurs if a patient withdraws from a study, i.e. is lost from the sample before the final outcome is observed. On the plot, small vertical tick-marks indicate losses, where a patient's survival time has been right-censored. When no truncation or censoring occurs, the Kaplan–Meier curve is equivalent to the <a title="Empirical distribution" href="/wiki/Empirical_distribution"><font color="#0645ad">empirical distribution</font></a>.</p> | ||
<p>In <a title="Medical statistics" href="/wiki/Medical_statistics"><font color="#0645ad">medical statistics</font></a>, a typical application might involve grouping patients into categories, for instance, those with Gene A profile and those with Gene B profile. In the graph, patients with Gene B die much more quickly than those with gene A. After two years about 80% of the Gene A patients still survive, but less than half of patients with Gene B.</p> | <p>In <a title="Medical statistics" href="/wiki/Medical_statistics"><font color="#0645ad">medical statistics</font></a>, a typical application might involve grouping patients into categories, for instance, those with Gene A profile and those with Gene B profile. In the graph, patients with Gene B die much more quickly than those with gene A. After two years about 80% of the Gene A patients still survive, but less than half of patients with Gene B.</p> | ||
| + | <p> </p> | ||
| + | <p> </p> | ||
| + | <p> </p> | ||
| + | <p> </p> | ||
<p> </p> | <p> </p> | ||
<p> </p> | <p> </p> | ||
<p> </p> | <p> </p> | ||
Latest revision as of 01:37, 27 January 2011
The Kaplan–Meier estimator (named after Edward L. Kaplan and Paul Meier), also known as the product limit estimator, estimates the survival function from life-time data. In medical research, it might be used to measure the fraction of patients living for a certain amount of time after treatment. An economist might measure the length of time people remain unemployed after a job loss. An engineer might measure the time until failure of machine parts. An ecologist may use it to estimate how long fleshy fruits remain on plants before they are removed by frugivores.
A plot of the Kaplan–Meier estimate of the survival function is a series of horizontal steps of declining magnitude which, when a large enough sample is taken, approaches the true survival function for that population. The value of the survival function between successive distinct sampled observations ("clicks") is assumed to be constant.
An important advantage of the Kaplan–Meier curve is that the method can take into account some types of censored data, particularly right-censoring, which occurs if a patient withdraws from a study, i.e. is lost from the sample before the final outcome is observed. On the plot, small vertical tick-marks indicate losses, where a patient's survival time has been right-censored. When no truncation or censoring occurs, the Kaplan–Meier curve is equivalent to the empirical distribution.
In medical statistics, a typical application might involve grouping patients into categories, for instance, those with Gene A profile and those with Gene B profile. In the graph, patients with Gene B die much more quickly than those with gene A. After two years about 80% of the Gene A patients still survive, but less than half of patients with Gene B.